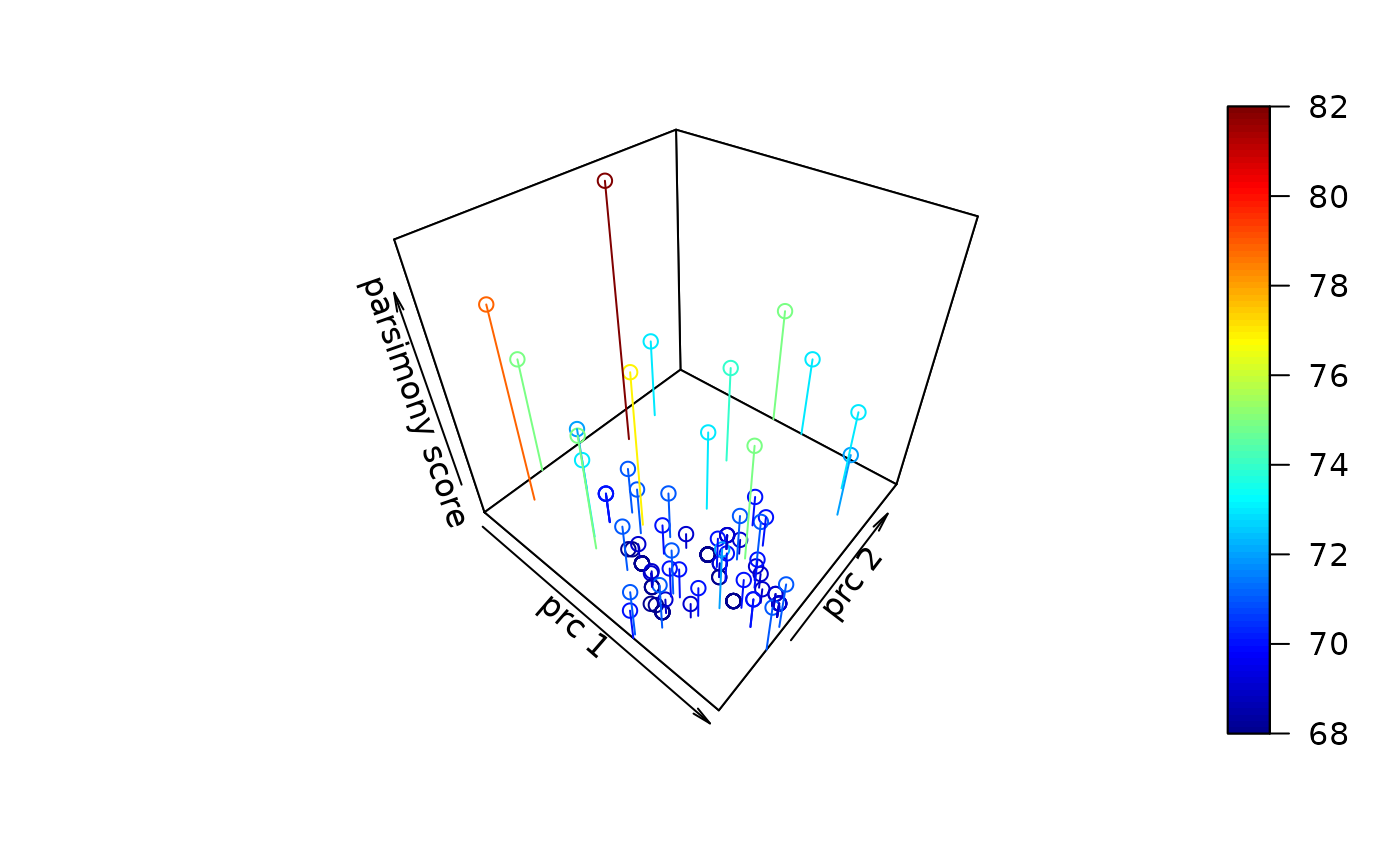
terraces visualizes in likelihood surface for the tree space
(Sanderson et al. 2011). Usually trees are from a bootstrap or MCMC sample.
There the first two axis are the principle components of distances between
trees and the third axis is the likelihood value. We also allow parsimony
score, minimum evolution criteria or least squares as criterion.
Usage
terraces(x, ...)

# S3 method for class 'pml'
terraces(x, trees = x$bs, dist_fun = "RF.dist",
  di2multi = FALSE, tol = 2e-08, plot = TRUE, ...)

# S3 method for class 'phyDat'
terraces(x, trees, dist_fun = "RF.dist", di2multi = FALSE,
  tol = 2e-08, plot = TRUE, ...)

# S3 method for class 'dist'
terraces(x, trees, dist_fun = "RF.dist", di2multi = FALSE,
  tol = 2e-08, plot = TRUE, crit = "ME", ...)
Arguments
- x
an object of class
pml- ...
Further arguments passed to or from other methods.
- trees
an object of class
multiPhylo- dist_fun
a function to compute distances between trees see e.g.
RF.dist- di2multi
logical, should polytomies get collapsed. Useful for Robinson-Foulds distance. If edge length are used to compute the distance, e.g. Kuhner-Felsenstein distance, this is not needed.
- tol
a numeric value giving the tolerance to consider a branch length significantly greater than zero.
- plot
logical if TRUE a 3D scatter is shown.
- crit
either "ME" (minimum) or "RSS" (residual sum of squares) if x is a dist object.
References
Sanderson, M.J., McMahon, M.M. and Steel, M. (2011). Terraces in phylogenetic tree space. Science, 333, 448–450.
Author
Klaus Schliep klaus.schliep@gmail.com
Examples
data(woodmouse)
trs <- pratchet(woodmouse, all=TRUE)
start_trs <- get("start_trees", envir = attr(trs, "env"))
terraces(as.phyDat(woodmouse), c(trs, start_trs))
#> Some trees are not binary. Result may not what you expect!
#> Warning: no DISPLAY variable so Tk is not available


if (FALSE) { # \dontrun{
fit <- pml_bb(woodmouse, model="JC")
terraces(fit, dist_fun="KF.dist")
terraces(fit, pkg="scatterplot3d")
terraces(fit, pkg="plot3D")
terraces(fit, pkg="rgl")
} # }
if (FALSE) { # \dontrun{
fit <- pml_bb(woodmouse, model="JC")
terraces(fit, dist_fun="KF.dist")
terraces(fit, pkg="scatterplot3d")
terraces(fit, pkg="plot3D")
terraces(fit, pkg="rgl")
} # }