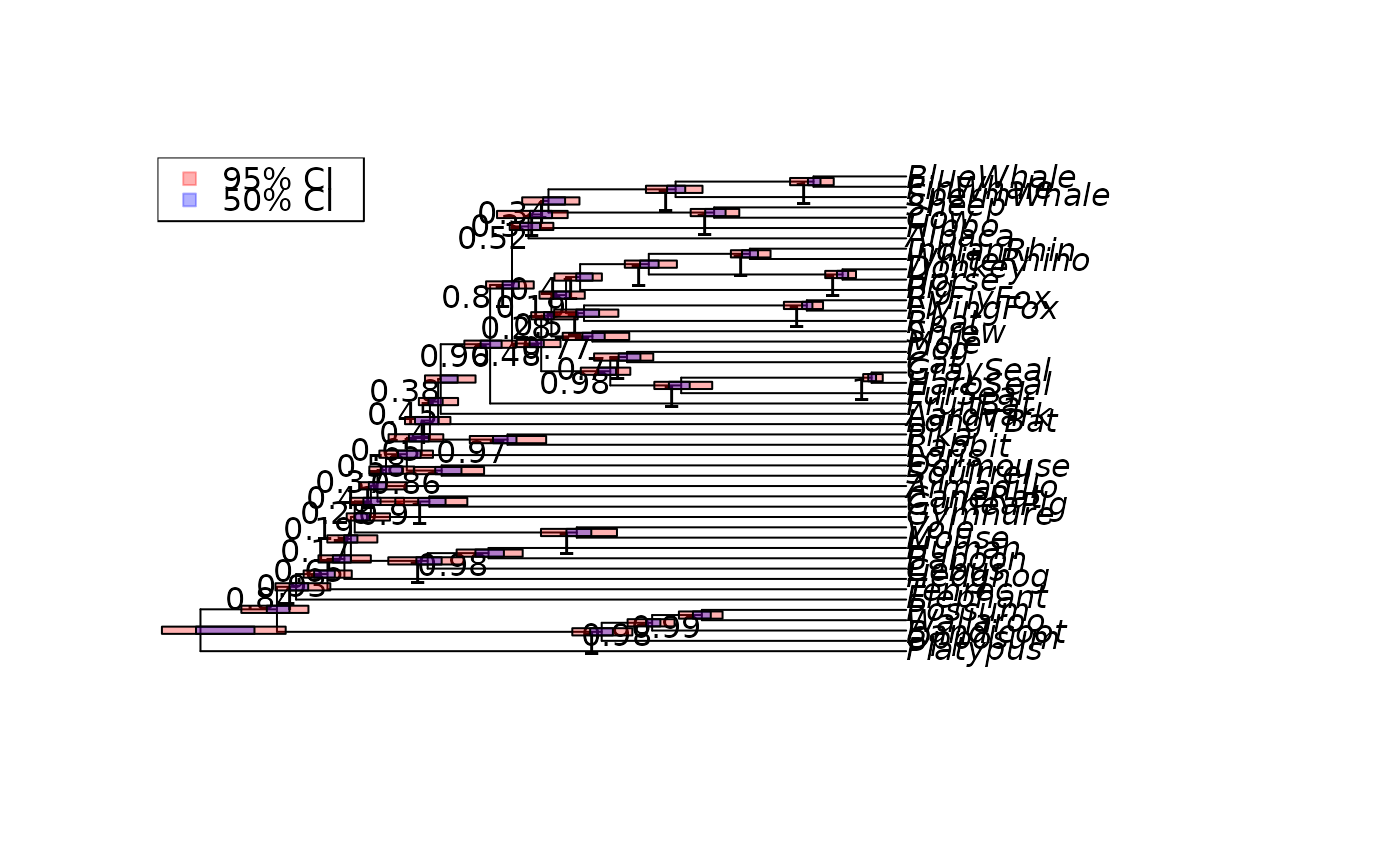
These are low-level plotting commands to draw the confidence intervals on the node of a tree as rectangles with coloured backgrounds or add boxplots to ultrametric or tipdated trees.
Usage
add_ci(tree, trees = NULL, col95 = "#FF00004D", col50 = "#0000FF4D",
  height = 0.7, legend = TRUE, ...)

add_boxplot(tree, trees = NULL, boxwex = 0.7, ...)
Arguments
- tree
either an object of class phylo to which the confidences should be added or an object of class
pml. In case of the later the tree is extracted from the object.- trees
phylogenetic trees, i.e. an object of class
multiPhylo. Can be empty if tree is an object of classpml.- col95
colour used for the 95% intervals; by default: transparent red.
- col50
colour used for the 50% intervals; by default: transparent blue.
- height
the height of the boxes.
- legend
a logical value.
- ...
- boxwex
a scale factor to be applied to all boxes, see
bxp.
Examples
data("Laurasiatherian")
dm <- dist.hamming(Laurasiatherian)
tree <- upgma(dm)
set.seed(123)
trees <- bootstrap.phyDat(Laurasiatherian,
                          FUN=function(x)upgma(dist.hamming(x)), bs=100)
tree <- plotBS(tree, trees, "phylogram")
add_ci(tree, trees, bty="n")

plot(tree, direction="downwards")
add_boxplot(tree, trees, boxwex=.7)
plot(tree, direction="downwards")
add_boxplot(tree, trees, boxwex=.7)
