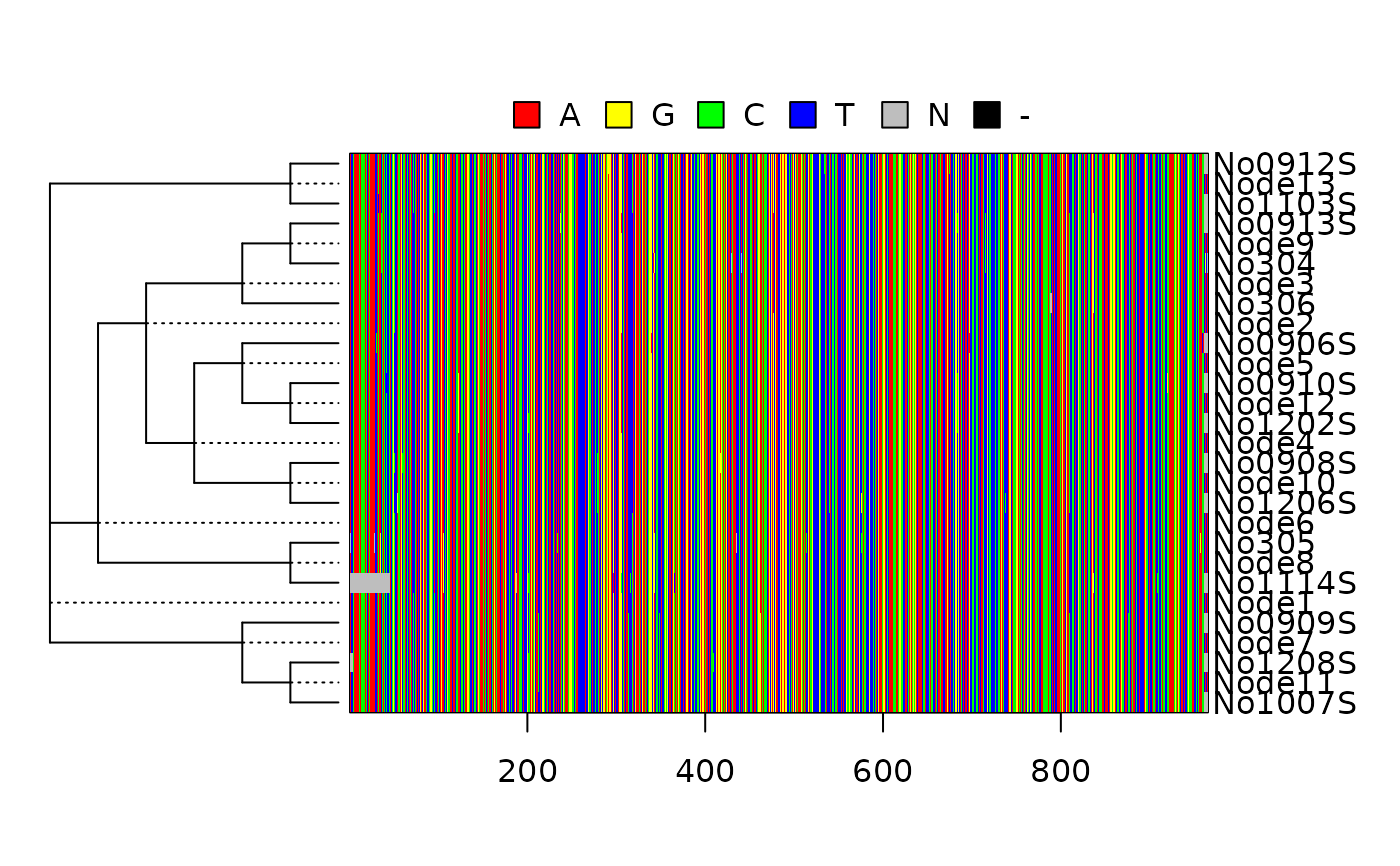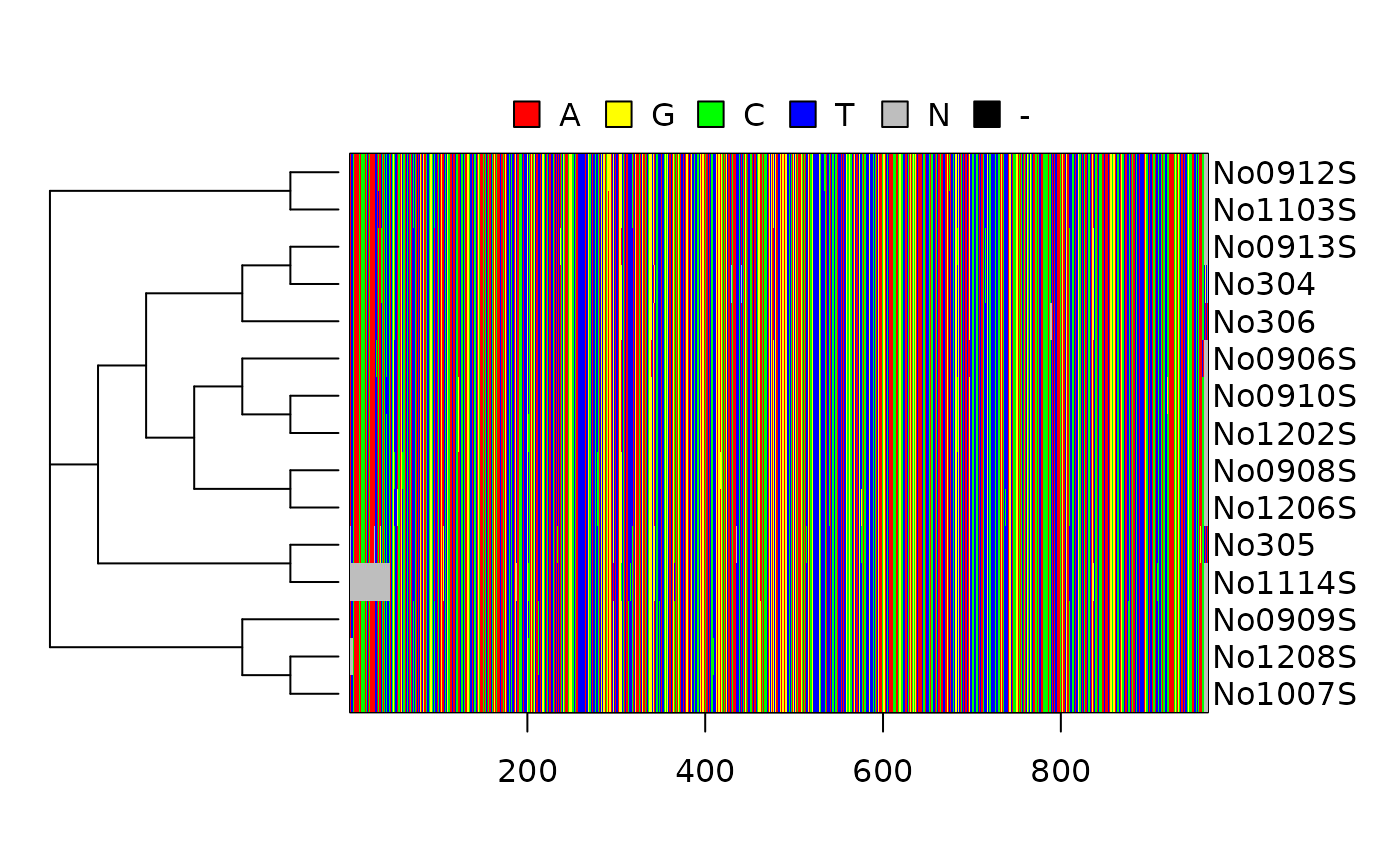
Plots a heat map with ancestral states.
Usage
heatmapp(x, ...)

# S3 method for class 'phylo'
heatmapp(x, y, use.edge.length = TRUE, align_label = TRUE,
  clade = NULL, select = NULL, cex.lab = 1, nodes = FALSE, ...)

# S3 method for class 'pml'
heatmapp(x, ...)

# S3 method for class 'ancestral'
heatmapp(x, nodes = TRUE, ...)
Arguments
- x
an object of class ancestral or phyDat.
- ...
Further arguments passed to or from other methods.
- y
an object of class phyDat.
- use.edge.length
a logical indicating whether to use the edge lengths of the phylogeny to draw the branches (the default) or not (if FALSE). This option has no effect if the object of class "phylo" has no ‘edge.length’ element.
- align_label
a logical value or an integer. If TRUE, the tips are aligned and dotted lines are drawn between the nodes of the tree and the labels.
- clade
a node number or label to extract the clade from the tree.
- select
a subset of characters, columns in the alignment.
- cex.lab
font size of the labels.
- nodes
Show ancestral sequences at internal nodes.
Details
heatmapp plots a heatmap, a phylogeny together with the
alignment. For ancestral reconstructions it additionally plots the
joint distribution or the most likely state of the internal nodes.
This eases comparison of ancestors with related Descendant sequences.
heatmapp is based on the ape function splot.phylo and
image.AAbin or image.AAbin.
Author
Klaus Schliep klaus.schliep@gmail.com