plotAnc plots a phylogeny and adds character to the nodes. Either
takes output from ancestral.pars or ancestral.pml or from an
alignment where there are node labels in the tree match the constructed
sequences in the alignment.
Usage
plotAnc(tree, data, i = 1, site.pattern = FALSE, col = NULL,
  cex.pie = 0.5, pos = "bottomright", scheme = NULL, ...)
Arguments
- tree
a tree, i.e. an object of class pml
- data
an object of class
phyDatorancestral.- i
plots the i-th site of the
data.- site.pattern
logical, plot i-th site pattern or i-th site
- col
a vector containing the colors for all possible states.
- cex.pie
a numeric defining the size of the pie graphs.
- pos
a character string defining the position of the legend.
- scheme
a predefined color scheme. For amino acid options are "Ape_AA", "Zappo_AA", "Clustal", "Polarity" and "Transmembrane_tendency", for nucleotides "Ape_NT" and"RY_NT". Names can be abbreviated.
- ...
Further arguments passed to or from other methods.
Author
Klaus Schliep klaus.schliep@gmail.com
Examples
example(NJ)
#>
#> NJ> data(Laurasiatherian)
#>
#> NJ> dm <- dist.ml(Laurasiatherian)
#>
#> NJ> tree <- NJ(dm)
#>
#> NJ> plot(tree)
 # generate node labels to ensure plotting will work
tree <- makeNodeLabel(tree)
anc.p <- ancestral.pars(tree, Laurasiatherian)
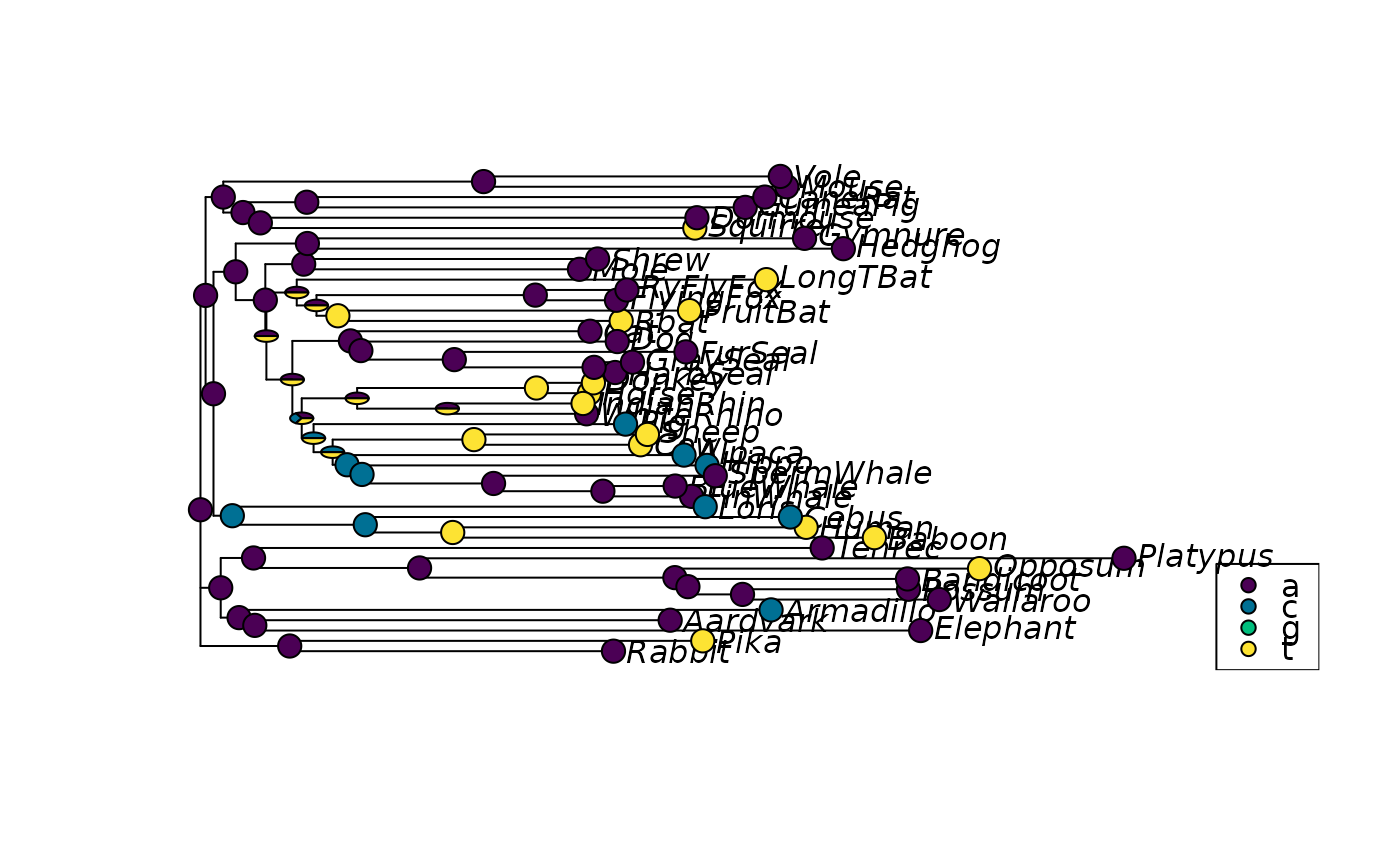
# plot the third character
plotAnc(tree, anc.p, 3)
# generate node labels to ensure plotting will work
tree <- makeNodeLabel(tree)
anc.p <- ancestral.pars(tree, Laurasiatherian)
# plot the third character
plotAnc(tree, anc.p, 3)
 data(chloroplast)
tree <- pratchet(chloroplast, maxit=10, trace=0)
tree <- makeNodeLabel(tree)
anc.ch <- ancestral.pars(tree, chloroplast)
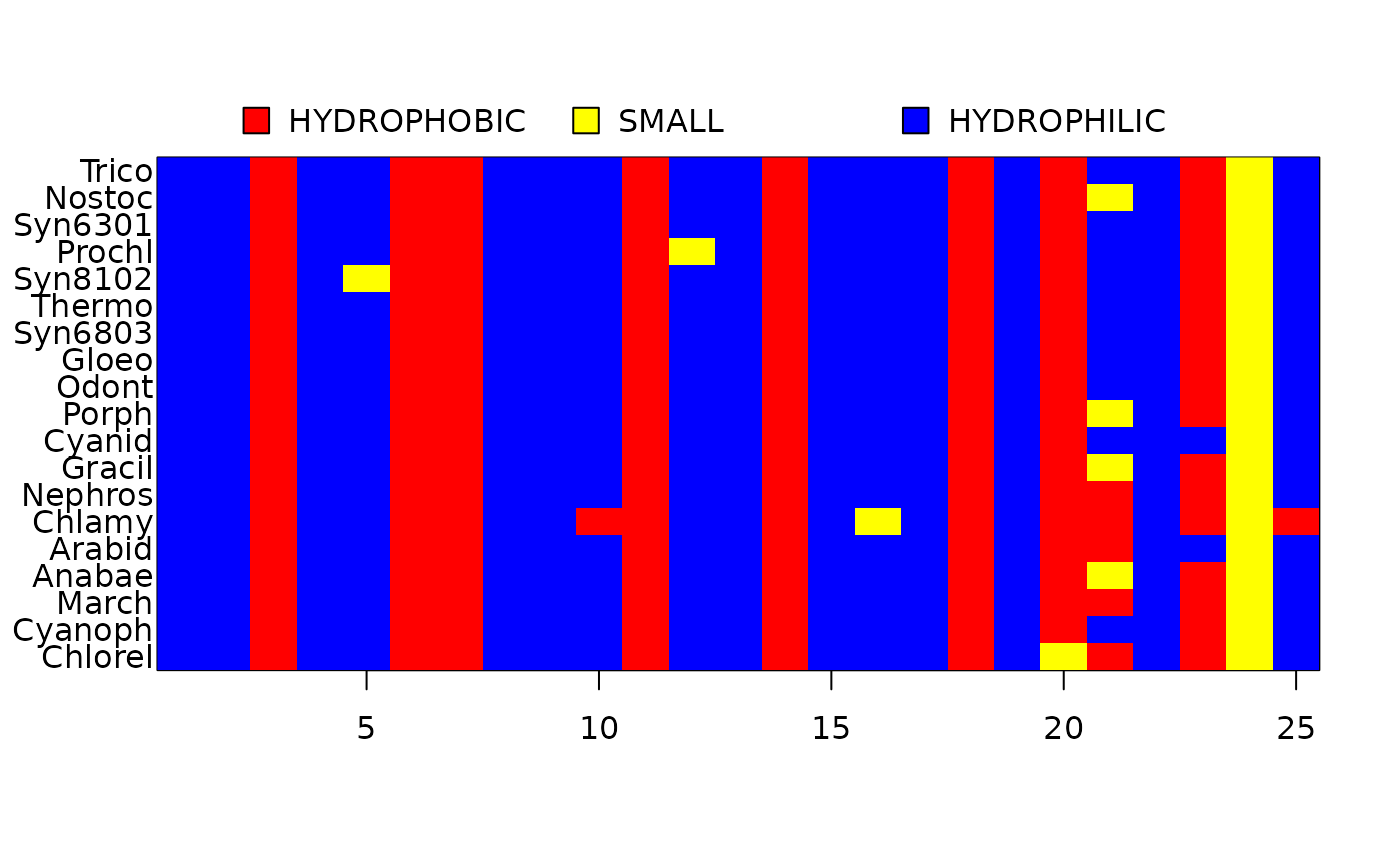
image(chloroplast[, 1:25])
data(chloroplast)
tree <- pratchet(chloroplast, maxit=10, trace=0)
tree <- makeNodeLabel(tree)
anc.ch <- ancestral.pars(tree, chloroplast)
image(chloroplast[, 1:25])
 #> NULL
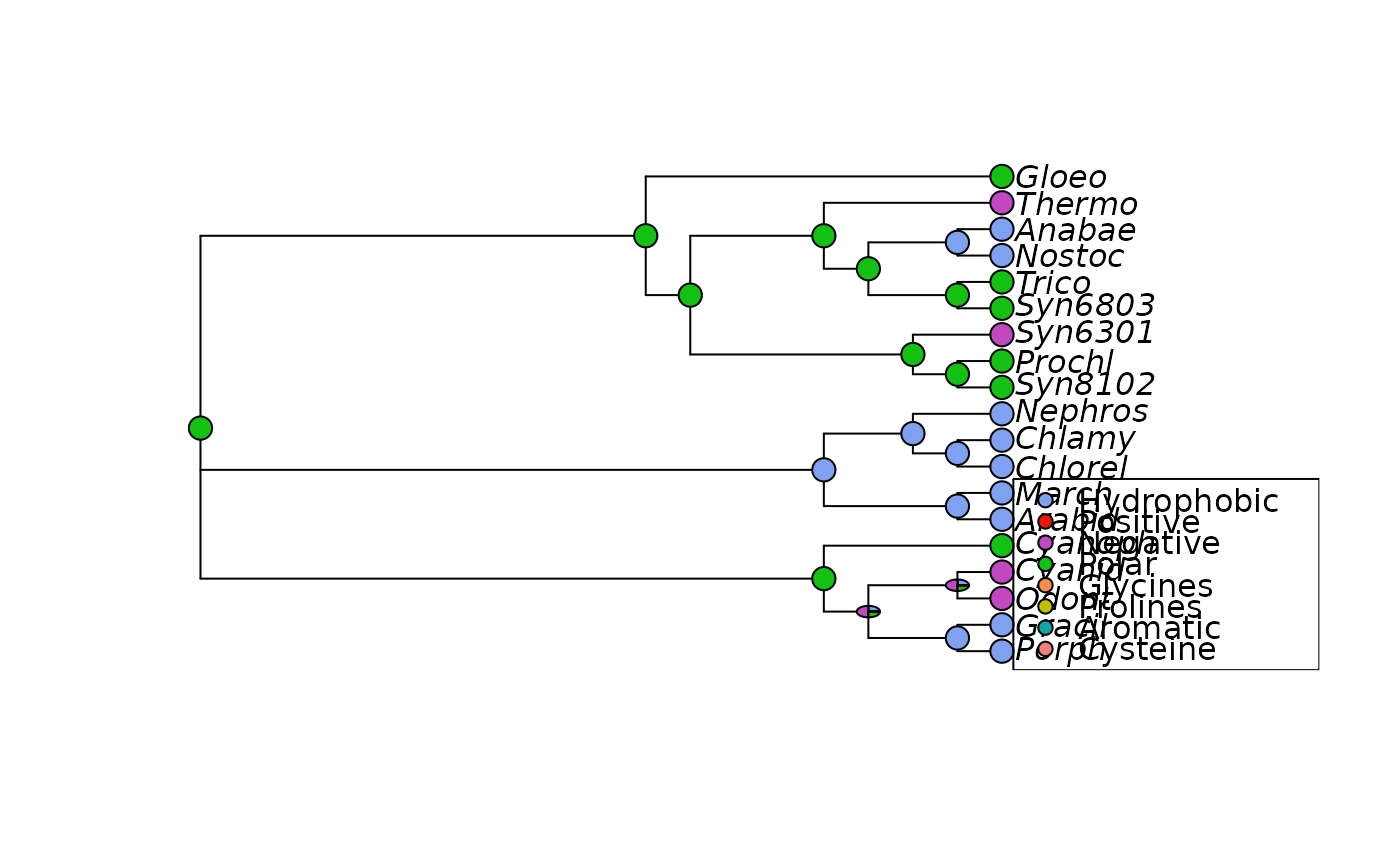
plotAnc(tree, anc.ch, 21, scheme="Ape_AA")
#> NULL
plotAnc(tree, anc.ch, 21, scheme="Ape_AA")
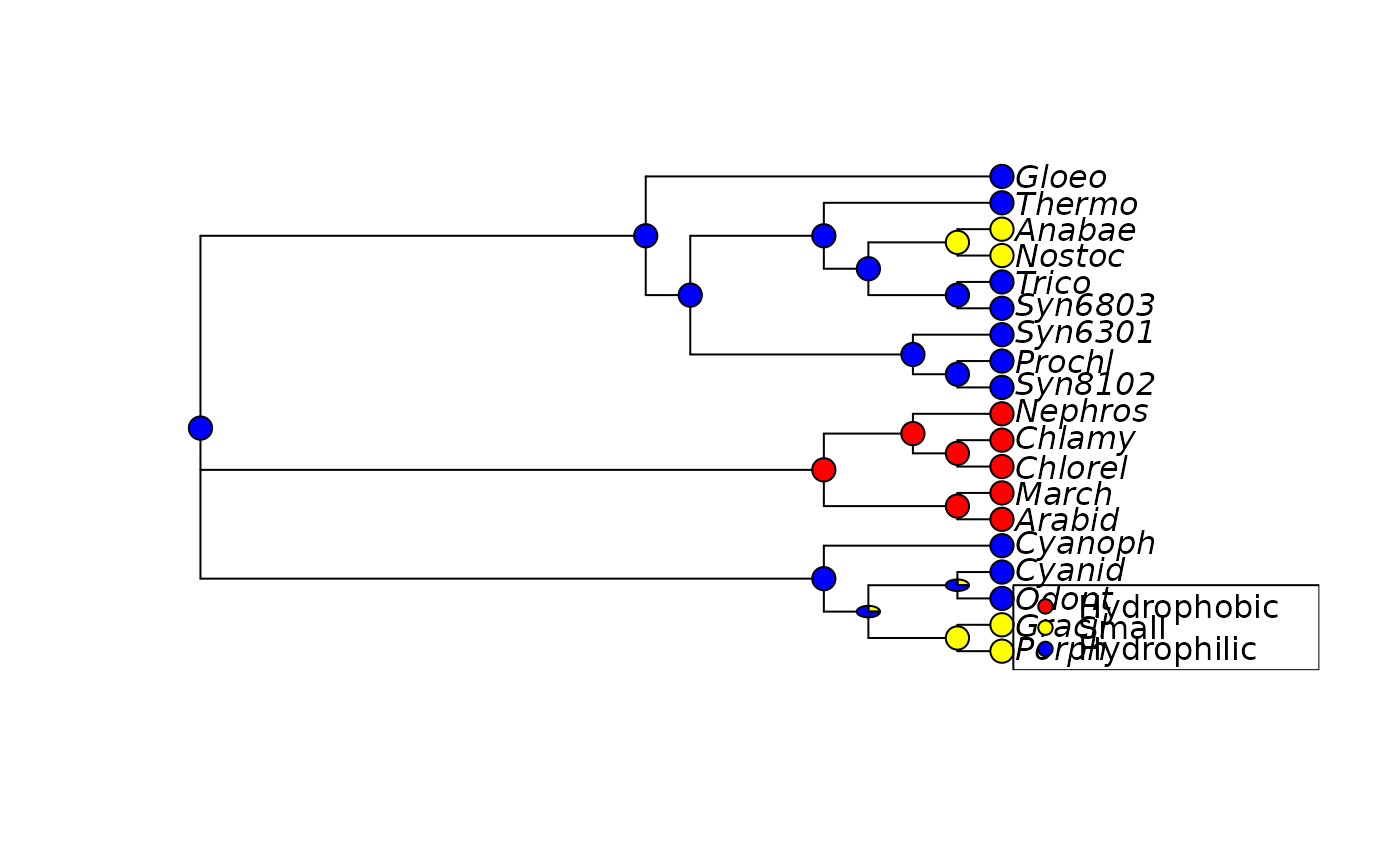 plotAnc(tree, anc.ch, 21, scheme="Clustal")