So far not all parameters behave the same on the the rgl "3D"
and basic graphic "2D" device.
Usage
# S3 method for class 'networx'
plot(x, type = "equal angle", use.edge.length = TRUE,
  show.tip.label = TRUE, show.edge.label = FALSE, edge.label = NULL,
  show.node.label = FALSE, node.label = NULL, show.nodes = FALSE,
  tip.color = "black", edge.color = "black", edge.width = 1,
  edge.lty = 1, split.color = NULL, split.width = NULL,
  split.lty = NULL, font = 3, cex = par("cex"), cex.node.label = cex,
  cex.edge.label = cex, col.node.label = tip.color,
  col.edge.label = tip.color, font.node.label = par("font"),
  font.edge.label = par("font"), underscore = FALSE, angle = 0,
  digits = 2, ...)
Arguments
- x
an object of class
"networx"- type
"3D" to plot using rgl or "equal angle", "2D" or "outline" in the normal device.
- use.edge.length
a logical indicating whether to use the edge weights of the network to draw the branches (the default) or not.
- show.tip.label
a logical indicating whether to show the tip labels on the graph (defaults to
TRUE, i.e. the labels are shown).- show.edge.label
a logical indicating whether to show the tip labels on the graph.
- edge.label
an additional vector of edge labels (normally not needed).
- show.node.label
a logical indicating whether to show the node labels (see example).
- node.label
an additional vector of node labels (normally not needed).
- show.nodes
a logical indicating whether to show the nodes (see example).
- tip.color
the colors used for the tip labels.
- edge.color
the colors used to draw edges.
- edge.width
the width used to draw edges.
- edge.lty
a vector of line types.
- split.color
the colors used to draw edges.
- split.width
the width used to draw edges.
- split.lty
a vector of line types.
- font
an integer specifying the type of font for the labels: 1 (plain text), 2 (bold), 3 (italic, the default), or 4 (bold italic).
- cex
a numeric value giving the factor scaling of the labels.
- cex.node.label
a numeric value giving the factor scaling of the node labels.
- cex.edge.label
a numeric value giving the factor scaling of the edge labels.
- col.node.label
the colors used for the node labels.
- col.edge.label
the colors used for the edge labels.
- font.node.label
the font used for the node labels.
- font.edge.label
the font used for the edge labels.
- underscore
a logical specifying whether the underscores in tip labels should be written as spaces (the default) or left as are (if TRUE).
- angle
rotate the plot.
- digits
if edge labels are numerical a positive integer indicating how many significant digits are to be used.
- ...
Further arguments passed to or from other methods.
Details
Often it is easier and safer to supply vectors of graphical parameters for splits (e.g. splits.color) than for edges. These overwrite values edge.color.
References
Dress, A.W.M. and Huson, D.H. (2004) Constructing Splits Graphs IEEE/ACM Transactions on Computational Biology and Bioinformatics (TCBB), 1(3), 109–115
Schliep, K., Potts, A. J., Morrison, D. A. and Grimm, G. W. (2017), Intertwining phylogenetic trees and networks. Methods Ecol Evol. 8, 1212–1220. doi:10.1111/2041-210X.12760
Bagci, C., Bryant, D., Cetinkaya, B. and Huson, D.H. (2021), Microbial Phylogenetic Context Using Phylogenetic Outlines. Genome Biology and Evolution. Volume 13. Issue 9. evab213
Author
Klaus Schliep klaus.schliep@gmail.com
Examples
set.seed(1)
tree1 <- rtree(20, rooted=FALSE)
sp <- as.splits(rNNI(tree1, n=10))
net <- as.networx(sp)
plot(net)
 plot(net, direction="horizontal")
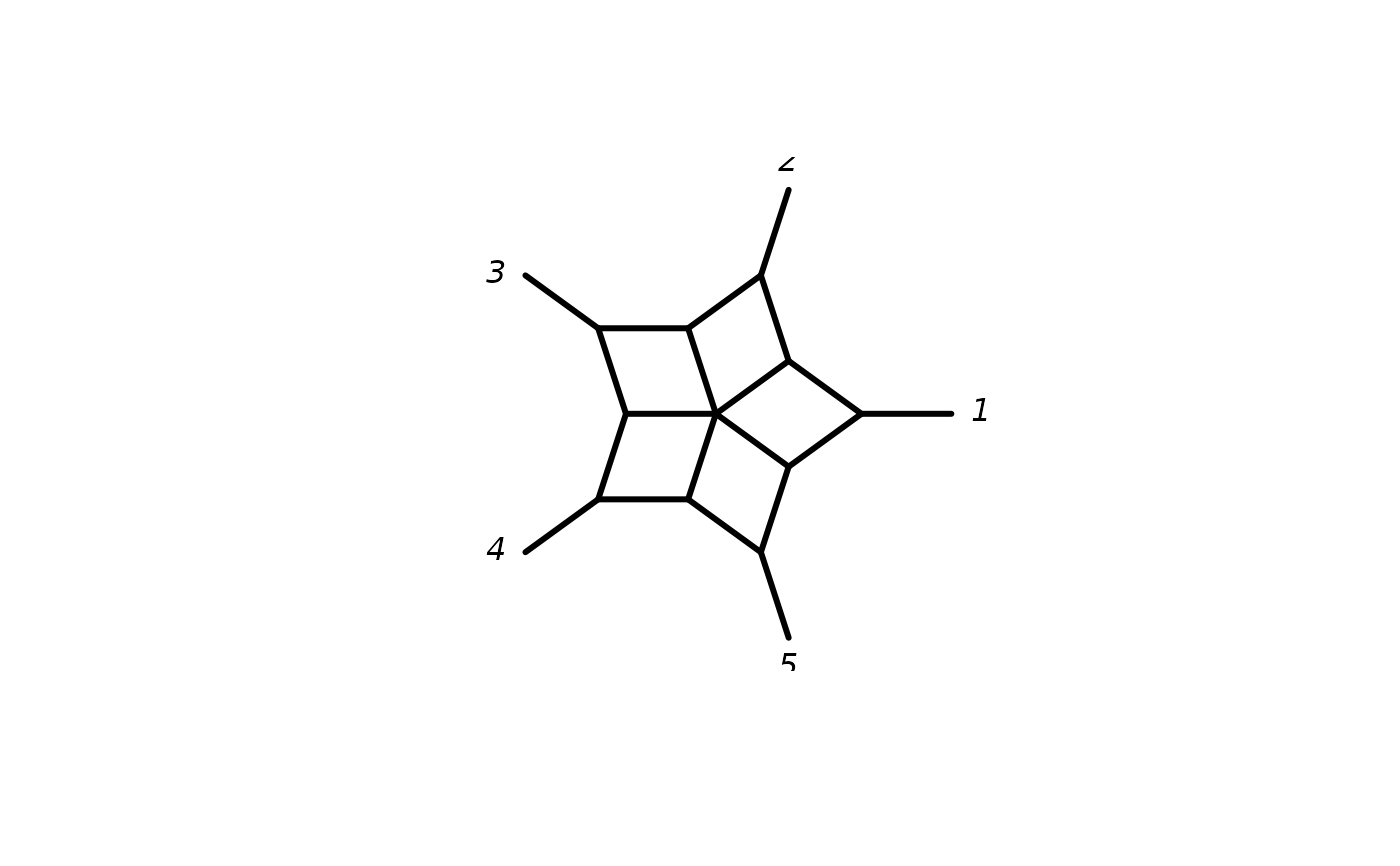
 circ_net <- allCircularSplits(5) |> as.networx()
plot(circ_net)
circ_net <- allCircularSplits(5) |> as.networx()
plot(circ_net)
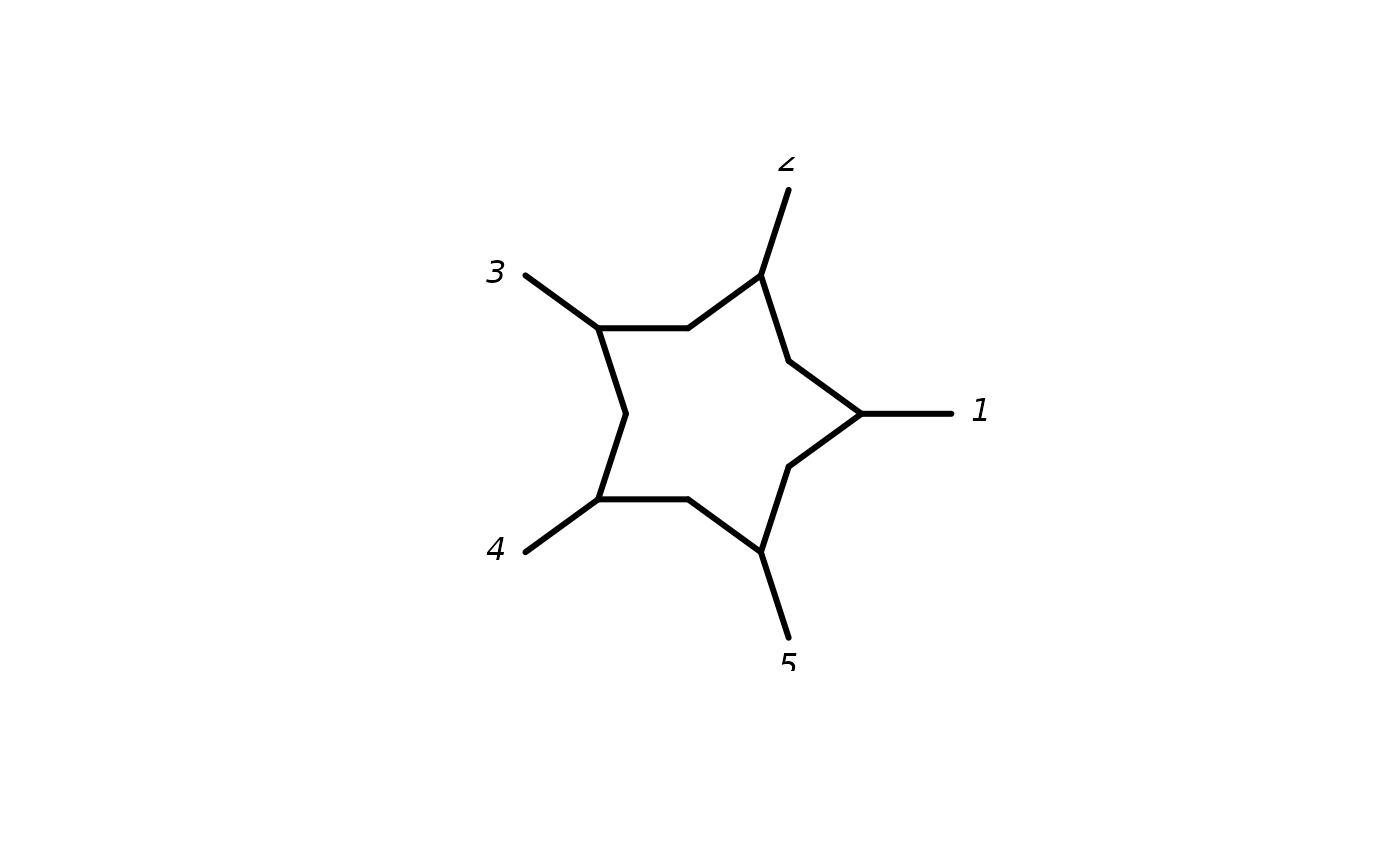
 plot(circ_net, type = "outline")
 if (FALSE) { # \dontrun{
# also see example in consensusNet
example(consensusNet)
} # }
if (FALSE) { # \dontrun{
# also see example in consensusNet
example(consensusNet)
} # }